

Our in-depth understanding of the ins and outs of our industry enables us to delivery results that drive our client’s growth.
OUR CLIENT’S RESULTS.
Superior Healthcare


We returned this client $559 for every $1 dollar spend. Achieving those results requires refining strategies over time with precision and tailor-made management.
This specific campaign received an SemRush Award.
RESULTS:
OUR CLIENT’S RESULTS.
Mocka
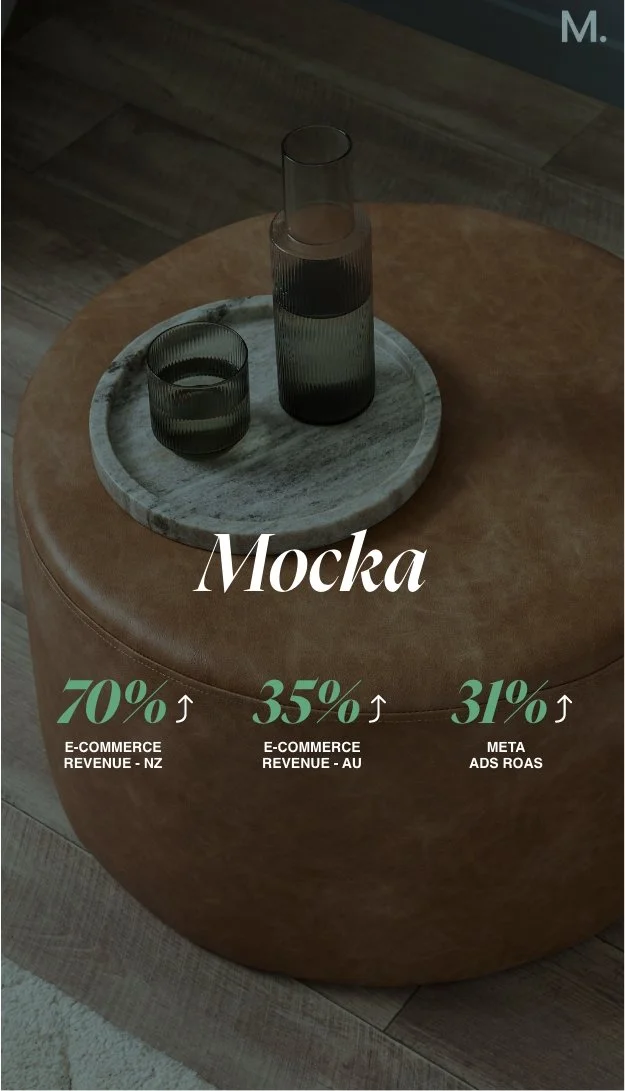

During the initial 12 months of our collaboration with Mocka, we focused on scaling their e-commerce business across Australia & New Zealand.
As a result of our efforts, we successfully achieved an impressive 35% increase in their return on investment for Australia and a huge 70% increase in New Zealand.
RESULTS:
OUR CLIENT’S RESULTS.
Get Frocked


Over a 6 months period, we increased Get Frocked return on investment by 56%.
SEM delivered a 111% increase in total purchase and Meta delivered a 101% increase in total purchase.
Achieving those results is based on a bespoke strategy and refinements made over time.
RESULTS:
OUR CLIENT’S RESULTS.
Strong Formula


Within 4 months of launching the campaign, we acquired over 1000+ leads at a small cost of $2.02 to acquire a lead delivering a 137% increase in revenue.
Establishing a full-funnel strategy across both platforms was crucial for the success of our client.
RESULTS:
OUR CLIENT’S RESULTS.
Fetchit


Achieved a 103% increase in their overall sales through their sem & social advertising campaigns.
Establishing a full-funnel strategy across both platforms was crucial for the success of our client.
RESULTS:
GET CONCRETE RESULTS.
Be our next success story.
JOIN US.
Ready to start your growth?
We believe in the work we do and that’s why transparency is one of our key pillars. You have full control over everything we create, and if you decide to move on, your data and accounts are yours to keep. In a digital-first world, owning and understanding what drives your business is crucial, and we’re here to ensure you have that control.